i’ll skip part with docker installation and put here only config files
[root@prod-oracle-rac grafana]# tree
.
├── 1.sh
├── alertmanager
│   ├── alert.tmpl
│   ├── config.yml
│   └── data
│   ├── nflog
│   └── silences
├── docker-compose.yaml
├── grafana
│   ├── alerting
│   │   └── 1
│   │   └── default.tmpl
│   ├── csv
│   ├── file-collections
│   ├── grafana.db
│   ├── plugins
│   ├── png
│   └── provisioning
├── oracledbexporter
│   └── custom-metrics.toml
└── prometheus
├── alert_rules.yml
└── prometheus.yml
cat docker-compose.yaml
don’t forget to change username\userpass in tns connect string
version: '3.3'
services:

  prometheus:
    image: prom/prometheus:latest
    volumes:
      - ./prometheus/:/etc/prometheus/
    container_name: prometheus
    hostname: prometheus
    command: ["--config.file=/etc/prometheus/prometheus.yml", "--log.level=debug"]
#command:
#      - --config.file=/etc/prometheus/prometheus.yml
#      - --LOG_LEVEL=debug
    links:
      - alertmanager:alertmanager
    ports:
      - 9090:9090
    restart: unless-stopped
    environment:
      TZ: "Europe/Moscow"
    networks:
      - default
    depends_on:
      - alertmanager
  node-exporter:
    image: prom/node-exporter
    volumes:
      - /proc:/host/proc:ro
      - /sys:/host/sys:ro
      - /:/rootfs:ro
    container_name: exporter
    hostname: exporter
    command:
      - --path.procfs=/host/proc
      - --path.sysfs=/host/sys
      - --collector.filesystem.ignored-mount-points
      - ^/(sys|proc|dev|host|etc|rootfs/var/lib/docker/containers|rootfs/var/lib/docker/overlay2|rootfs/run/docker/netns|rootfs/var/lib/docker/aufs)($$|/)
    ports:
      - 9100:9100
    restart: unless-stopped
    environment:
      TZ: "Europe/Moscow"
    networks:
      - default

  grafana:
    image: grafana/grafana
    restart: always
    user: root
    depends_on:
      - prometheus
    ports:
      - 3000:3000
    volumes:
      - ./grafana:/var/lib/grafana
      - ./grafana/provisioning/:/etc/grafana/provisioning/
    container_name: grafana
    hostname: grafana
    restart: unless-stopped
    environment:
      TZ: "Europe/Moscow"
    networks:
      - default

  alertmanager:
    image: prom/alertmanager:latest
    user: root
    ports:
      - 127.0.0.1:9093:9093
    volumes:
      - ./alertmanager/:/etc/alertmanager/
    container_name: alertmanager
    hostname: alertmanager
    environment:
      TZ: "Europe/Moscow"
    restart: unless-stopped
    command:
      - '--config.file=/etc/alertmanager/config.yml'
      - '--storage.path=/etc/alertmanager/data'
    networks:
      - default


  oracledbexporter:
    image: iamseth/oracledb_exporter
    volumes:
      - ./oracledbexporter:/etc/oracledb_exporter
    environment:
      - 'NLS_LANG=AMERICAN_AMERICA.WE8ISO8859P1'
      - 'DATA_SOURCE_NAME=username/userpass@10.100.18.11:1521/a49prm'
      - 'CUSTOM_METRICS=/etc/oracledb_exporter/custom-metrics.toml'
    restart: unless-stopped
    expose:
      -  9161
    network_mode: host

networks:
  default:
    ipam:
      driver: default
      config:
        - subnet: 172.28.0.0/16
alertmanager config.yaml
# Отсюда читаем все шаблоны:
templates:
  - '/etc/alertmanager/template/*.tmpl'
route:
  # Группировка алертов
  group_by: ['alertname', 'cluster', 'service']
  # время ожидания перед отправкой уведомления для группы
  group_wait: 30s
  # время отправки повторного сообщения для группы
  group_interval: 5m
  # время до отправки повторного сообщения
  repeat_interval: 30m
  receiver: 'telega'
receivers:
  - name: 'telega'
    telegram_configs:
    - bot_token: 'xxxx:xxxxxxxxxxx'
      chat_id: -xxxxxxxxxxxxxx
      api_url: 'https://api.telegram.org'
      message:  "Alertname: {{ .GroupLabels.alertname }}\n Severity: {{ .CommonLabels.severity }}\n {{ range .Alerts }}{{ .Annotations.description }}\n{{ end }}"
      parse_mode: ''
      send_resolved: true
prometheus prometheus.yml
scrape_configs:
  - job_name: oracle_rac
    scrape_interval: 5s
    static_configs:
    - targets: ['node-exporter:9100']
  - job_name: oracle_db12
    scrape_interval: 5s
    static_configs:
    - targets: ['10.100.18.12:9100']
  - job_name: oracle_db11
    scrape_interval: 5s
    static_configs:
    - targets: ['10.100.18.11:9100']
  - job_name: 'oracle-exporter'
    scrape_interval: 10s
    scrape_timeout: 8s
    static_configs:
    - targets: ['10.100.18.10:9161']

rule_files:
  - alert_rules.yml
alerting:
  alertmanagers:
    - static_configs:
      - targets: ["alertmanager:9093"]
prometheus alert_rules.yml
groups:
- name: nodeexporter
rules:
- alert: HostOutOfMemory
expr: node_memory_MemAvailable_bytes / node_memory_MemTotal_bytes * 100 < 10
for: 2m
labels:
severity: warning
annotations:
summary: Host out of memory (instance {{ $labels.instance }})
description: "Node memory is filling up (< 10% left)\n VALUE = {{ $value }}\n LABELS = {{ $labels }}"
- alert: HostMemoryUnderMemoryPressure
expr: rate(node_vmstat_pgmajfault[1m]) > 1000
for: 2m
labels:
severity: warning
annotations:
summary: Host memory under memory pressure (instance {{ $labels.instance }})
description: "The node is under heavy memory pressure. High rate of major page faults\n VALUE = {{ $value }}\n LABELS = {{ $labels }}"
- alert: HostUnusualNetworkThroughputIn
expr: sum by (instance) (rate(node_network_receive_bytes_total[2m])) / 1024 / 1024 > 100
for: 5m
labels:
severity: warning
annotations:
summary: Host unusual network throughput in (instance {{ $labels.instance }})
description: "Host network interfaces are probably receiving too much data (> 100 MB/s)\n VALUE = {{ $value }}\n LABELS = {{ $labels }}"
- alert: HostUnusualNetworkThroughputOut
expr: sum by (instance) (rate(node_network_transmit_bytes_total[2m])) / 1024 / 1024 > 100
for: 5m
labels:
severity: warning
annotations:
summary: Host unusual network throughput out (instance {{ $labels.instance }})
description: "Host network interfaces are probably sending too much data (> 100 MB/s)\n VALUE = {{ $value }}\n LABELS = {{ $labels }}"
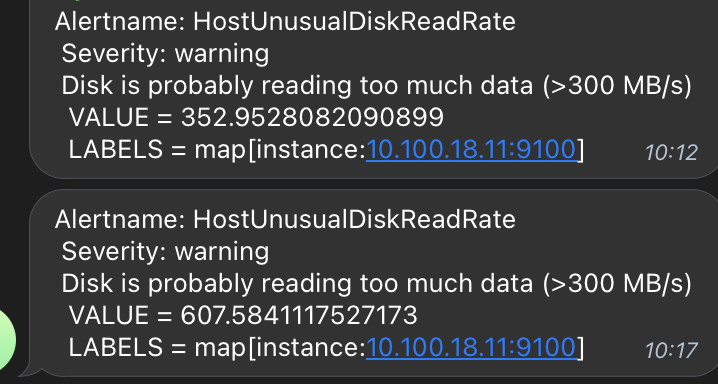
- alert: HostUnusualDiskReadRate
expr: sum by (instance) (rate(node_disk_read_bytes_total[2m])) / 1024 / 1024 > 400
for: 10m
labels:
severity: warning
annotations:
summary: Host unusual disk read rate (instance {{ $labels.instance }})
description: "Disk is probably reading too much data (>400 MB/s)\n VALUE = {{ $value }}\n LABELS = {{ $labels }}"
- alert: HostUnusualDiskWriteRate
expr: sum by (instance) (rate(node_disk_written_bytes_total[2m])) / 1024 / 1024 > 400
for: 2m
labels:
severity: warning
annotations:
summary: Host unusual disk write rate (instance {{ $labels.instance }})
description: "Disk is probably writing too much data (>400 MB/s)\n VALUE = {{ $value }}\n LABELS = {{ $labels }}"
# Please add ignored mountpoints in node_exporter parameters like
# "--collector.filesystem.ignored-mount-points=^/(sys|proc|dev|run)($|/)".
# Same rule using "node_filesystem_free_bytes" will fire when disk fills for non-root users.
- alert: HostOutOfDiskSpace
expr: (node_filesystem_avail_bytes * 100) / node_filesystem_size_bytes < 10 and ON (instance, device, mountpoint) node_filesystem_readonly == 0
for: 2m
labels:
severity: critical
annotations:
summary: Host out of disk space (instance {{ $labels.instance }})
description: "Disk is almost full (< 10% left)\n VALUE = {{ $value }}\n LABELS = {{ $labels }}"
# Please add ignored mountpoints in node_exporter parameters like
# "--collector.filesystem.ignored-mount-points=^/(sys|proc|dev|run)($|/)".
# Same rule using "node_filesystem_free_bytes" will fire when disk fills for non-root users.
- alert: HostDiskWillFillIn24Hours
expr: (node_filesystem_avail_bytes * 100) / node_filesystem_size_bytes < 10 and ON (instance, device, mountpoint) predict_linear(node_filesystem_avail_bytes{fstype!~"tmpfs"}[1h], 24 * 3600) < 0 and ON (instance, device, mountpoint) node_filesystem_readonly == 0
for: 2m
labels:
severity: warning
annotations:
summary: Host disk will fill in 24 hours (instance {{ $labels.instance }})
description: "Filesystem is predicted to run out of space within the next 24 hours at current write rate\n VALUE = {{ $value }}\n LABELS = {{ $labels }}"
- alert: HostOutOfInodes
expr: node_filesystem_files_free{mountpoint ="/rootfs"} / node_filesystem_files{mountpoint="/rootfs"} * 100 < 10 and ON (instance, device, mountpoint) node_filesystem_readonly{mountpoint="/rootfs"} == 0
for: 2m
labels:
severity: warning
annotations:
summary: Host out of inodes (instance {{ $labels.instance }})
description: "Disk is almost running out of available inodes (< 10% left)\n VALUE = {{ $value }}\n LABELS = {{ $labels }}"
- alert: HostInodesWillFillIn24Hours
expr: node_filesystem_files_free{mountpoint ="/rootfs"} / node_filesystem_files{mountpoint="/rootfs"} * 100 < 10 and predict_linear(node_filesystem_files_free{mountpoint="/rootfs"}[1h], 24 * 3600) < 0 and ON (instance, device, mountpoint) node_filesystem_readonly{mountpoint="/rootfs"} == 0
for: 2m
labels:
severity: warning
annotations:
summary: Host inodes will fill in 24 hours (instance {{ $labels.instance }})
description: "Filesystem is predicted to run out of inodes within the next 24 hours at current write rate\n VALUE = {{ $value }}\n LABELS = {{ $labels }}"
- alert: HostUnusualDiskReadLatency
expr: rate(node_disk_read_time_seconds_total[1m]) / rate(node_disk_reads_completed_total[1m]) > 0.01 and rate(node_disk_reads_completed_total[1m]) > 0
for: 2m
labels:
severity: warning
annotations:
summary: Host unusual disk read latency (instance {{ $labels.instance }})
description: "Disk latency is growing (read operations > 10ms)\n VALUE = {{ $value }}\n LABELS = {{ $labels }}"
- alert: HostUnusualDiskWriteLatency
expr: rate(node_disk_write_time_seconds_total[1m]) / rate(node_disk_writes_completed_total[1m]) > 0.01 and rate(node_disk_writes_completed_total[1m]) > 0
for: 2m
labels:
severity: warning
annotations:
summary: Host unusual disk write latency (instance {{ $labels.instance }})
description: "Disk latency is growing (write operations > 10ms)\n VALUE = {{ $value }}\n LABELS = {{ $labels }}"
- alert: HostHighCpuLoad
expr: 100 - (avg by(instance) (rate(node_cpu_seconds_total{mode="idle"}[2m])) * 100) > 80
for: 0m
labels:
severity: warning
annotations:
summary: Host high CPU load (instance {{ $labels.instance }})
description: "CPU load is > 80%\n VALUE = {{ $value }}\n LABELS = {{ $labels }}"
- alert: HostCpuStealNoisyNeighbor
expr: avg by(instance) (rate(node_cpu_seconds_total{mode="steal"}[5m])) * 100 > 10
for: 0m
labels:
severity: warning
annotations:
summary: Host CPU steal noisy neighbor (instance {{ $labels.instance }})
description: "CPU steal is > 10%. A noisy neighbor is killing VM performances or a spot instance may be out of credit.\n VALUE = {{ $value }}\n LABELS = {{ $labels }}"
- alert: HostSystemdServiceCrashed
expr: node_systemd_unit_state{state="failed"} == 1
for: 0m
labels:
severity: warning
annotations:
summary: Host systemd service crashed (instance {{ $labels.instance }})
description: "systemd service crashed\n VALUE = {{ $value }}\n LABELS = {{ $labels }}"
- alert: HostOomKillDetected
expr: increase(node_vmstat_oom_kill[1m]) > 0
for: 0m
labels:
severity: warning
annotations:
summary: Host OOM kill detected (instance {{ $labels.instance }})
description: "OOM kill detected\n VALUE = {{ $value }}\n LABELS = {{ $labels }}"
- alert: HostEdacCorrectableErrorsDetected
expr: increase(node_edac_correctable_errors_total[1m]) > 0
for: 0m
labels:
severity: info
annotations:
summary: Host EDAC Correctable Errors detected (instance {{ $labels.instance }})
description: "Host {{ $labels.instance }} has had {{ printf \"%.0f\" $value }} correctable memory errors reported by EDAC in the last 5 minutes.\n VALUE = {{ $value }}\n LABELS = {{ $labels }}"
- alert: HostEdacUncorrectableErrorsDetected
expr: node_edac_uncorrectable_errors_total > 0
for: 0m
labels:
severity: warning
annotations:
summary: Host EDAC Uncorrectable Errors detected (instance {{ $labels.instance }})
description: "Host {{ $labels.instance }} has had {{ printf \"%.0f\" $value }} uncorrectable memory errors reported by EDAC in the last 5 minutes.\n VALUE = {{ $value }}\n LABELS = {{ $labels }}"
- alert: HostNetworkReceiveErrors
expr: rate(node_network_receive_errs_total[2m]) / rate(node_network_receive_packets_total[2m]) > 0.01
for: 2m
labels:
severity: warning
annotations:
summary: Host Network Receive Errors (instance {{ $labels.instance }})
description: "Host {{ $labels.instance }} interface {{ $labels.device }} has encountered {{ printf \"%.0f\" $value }} receive errors in the last two minutes.\n VALUE = {{ $value }}\n LABELS = {{ $labels }}"
- alert: HostNetworkTransmitErrors
expr: rate(node_network_transmit_errs_total[2m]) / rate(node_network_transmit_packets_total[2m]) > 0.01
for: 2m
labels:
severity: warning
annotations:
summary: Host Network Transmit Errors (instance {{ $labels.instance }})
description: "Host {{ $labels.instance }} interface {{ $labels.device }} has encountered {{ printf \"%.0f\" $value }} transmit errors in the last two minutes.\n VALUE = {{ $value }}\n LABELS = {{ $labels }}"
- alert: HostNetworkInterfaceSaturated
expr: (rate(node_network_receive_bytes_total{device!~"^tap.*"}[1m]) + rate(node_network_transmit_bytes_total{device!~"^tap.*"}[1m])) / node_network_speed_bytes{device!~"^tap.*"} > 0.8 < 10000
for: 1m
labels:
severity: warning
annotations:
summary: Host Network Interface Saturated (instance {{ $labels.instance }})
description: "The network interface \"{{ $labels.device }}\" on \"{{ $labels.instance }}\" is getting overloaded.\n VALUE = {{ $value }}\n LABELS = {{ $labels }}"
- alert: HostNetworkBondDegraded
expr: (node_bonding_active - node_bonding_slaves) != 0
for: 2m
labels:
severity: warning
annotations:
summary: Host Network Bond Degraded (instance {{ $labels.instance }})
description: "Bond \"{{ $labels.device }}\" degraded on \"{{ $labels.instance }}\".\n VALUE = {{ $value }}\n LABELS = {{ $labels }}"
- alert: HostConntrackLimit
expr: node_nf_conntrack_entries / node_nf_conntrack_entries_limit > 0.8
for: 5m
labels:
severity: warning
annotations:
summary: Host conntrack limit (instance {{ $labels.instance }})
description: "The number of conntrack is approaching limit\n VALUE = {{ $value }}\n LABELS = {{ $labels }}"
- alert: HostClockSkew
expr: (node_timex_offset_seconds > 0.05 and deriv(node_timex_offset_seconds[5m]) >= 0) or (node_timex_offset_seconds < -0.05 and deriv(node_timex_offset_seconds[5m]) <= 0)
for: 2m
labels:
severity: warning
annotations:
summary: Host clock skew (instance {{ $labels.instance }})
description: "Clock skew detected. Clock is out of sync. Ensure NTP is configured correctly on this host.\n VALUE = {{ $value }}\n LABELS = {{ $labels }}"
- alert: HostClockNotSynchronising
expr: min_over_time(node_timex_sync_status[1m]) == 0 and node_timex_maxerror_seconds >= 16
for: 2m
labels:
severity: warning
annotations:
summary: Host clock not synchronising (instance {{ $labels.instance }})
description: "Clock not synchronising. Ensure NTP is configured on this host.\n VALUE = {{ $value }}\n LABELS = {{ $labels }}"
- alert: HostRequiresReboot
expr: node_reboot_required > 0
for: 4h
labels:
severity: info
annotations:
summary: Host requires reboot (instance {{ $labels.instance }})
description: "{{ $labels.instance }} requires a reboot.\n VALUE = {{ $value }}\n LABELS = {{ $labels }}"
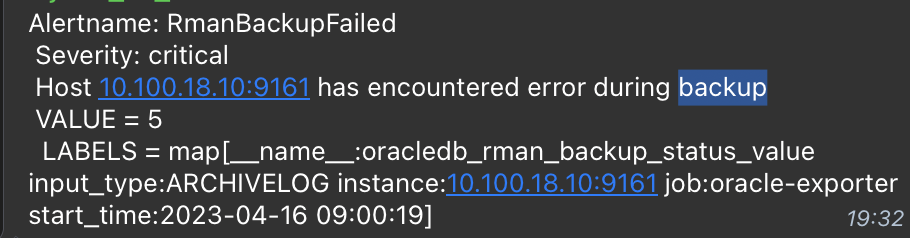
- alert: RmanBackupFailed
expr: oracledb_rman_backup_status_value > 3
for: 2m
labels:
severity: critical
annotations:
summary: oracle db backup failed (instance {{ $labels.instance }})
description: "Host {{ $labels.instance }} has encountered error during backup \n VALUE = {{ $value }}\n LABELS = {{ $labels }}"
- alert: instance_down
expr: oracledb_up{instance="10.100.18.10:9161"} <1
for: 0m
labels:
severity: critical
annotations:
summary: oracle db Down failed (instance {{ $labels.instance }})
description: "Host {{ $labels.instance }} unreacheable \n VALUE = {{ $value }}\n LABELS = {{ $labels }}"
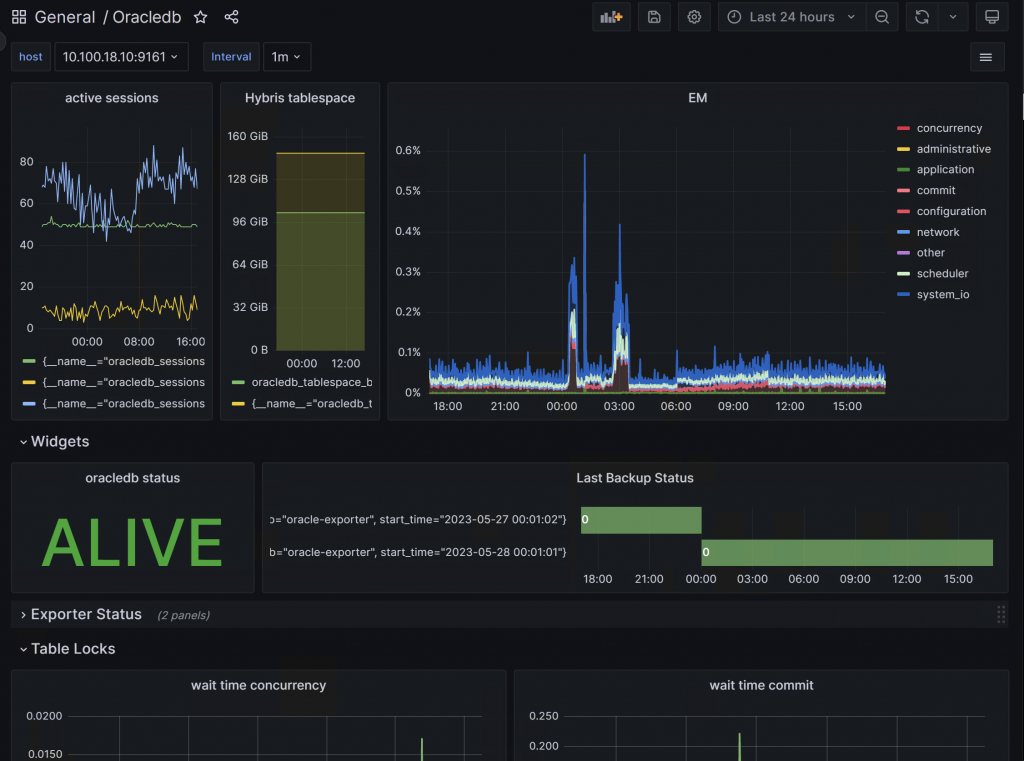
oracledbexporter custom-metrics.toml
[[metric]]
context = "system"
request = "select count(*) as session_count from v$session where username is not null and type = 'USER' and con_id = sys_context('userenv','con_id')"
metricsdesc = { session_count = "Current session count." }

[[metric]]
context = "system"
request = "select count(*) as active_sessions from v$session where username is not null and type = 'USER' and status = 'ACTIVE' and con_id = sys_context('userenv','con_id')"
metricsdesc = { active_sessions = "Active sessions." }

[[metric]]
context = "system"
request = "select (c.session_count - a.active_sessions) as inactive_sessions from (select count(*) as session_count from v$session where username is not null and type = 'USER' and con_id = sys_context('userenv','con_id')) c, (select count(*) as active_sessions from v$session where username is not null and type = 'USER' and status = 'ACTIVE' and con_id = sys_context('userenv','con_id')) a"
metricsdesc = { inactive_sessions = "Inactive sessions." }

[[metric]]
context = "system"
request = "select b.session_count as blocked_sessions from (select count(*) as session_count from v$session where username is not null and type = 'USER' and blocking_session_status = 'VALID' and con_id = sys_context('userenv','con_id')) b"
metricsdesc = { blocked_sessions = "Blocked sessions." }

[[metric]]
context = "rman_backup_status"
labels = [ "start_time", "input_type" ]
metricsdesc = { value="Gauge metric with rman backup status (5:FAILED; 4:RUNNING WITH ERRORS; 3:COMPLETED WITH ERRORS; 2:RUNNING WITH WARNINGS; 1:COMPLETED WITH WARNINGS; 0:COMPLETED)." }
request = '''
SELECT to_char(start_time, 'yyyy-mm-dd hh24:mi:ss') as start_time
,      input_type
,      cast( decode(status, 'FAILED', 5, 'RUNNING WITH ERRORS', 4, 'COMPLETED WITH ERRORS', 3, 'RUNNING WITH WARNINGS', 2, 'COMPLETED WITH WARNINGS', 1, 0) as integer) as value
FROM v$rman_backup_job_details
WHERE start_time = (SELECT max(start_time) FROM v$rman_backup_job_details)
'''
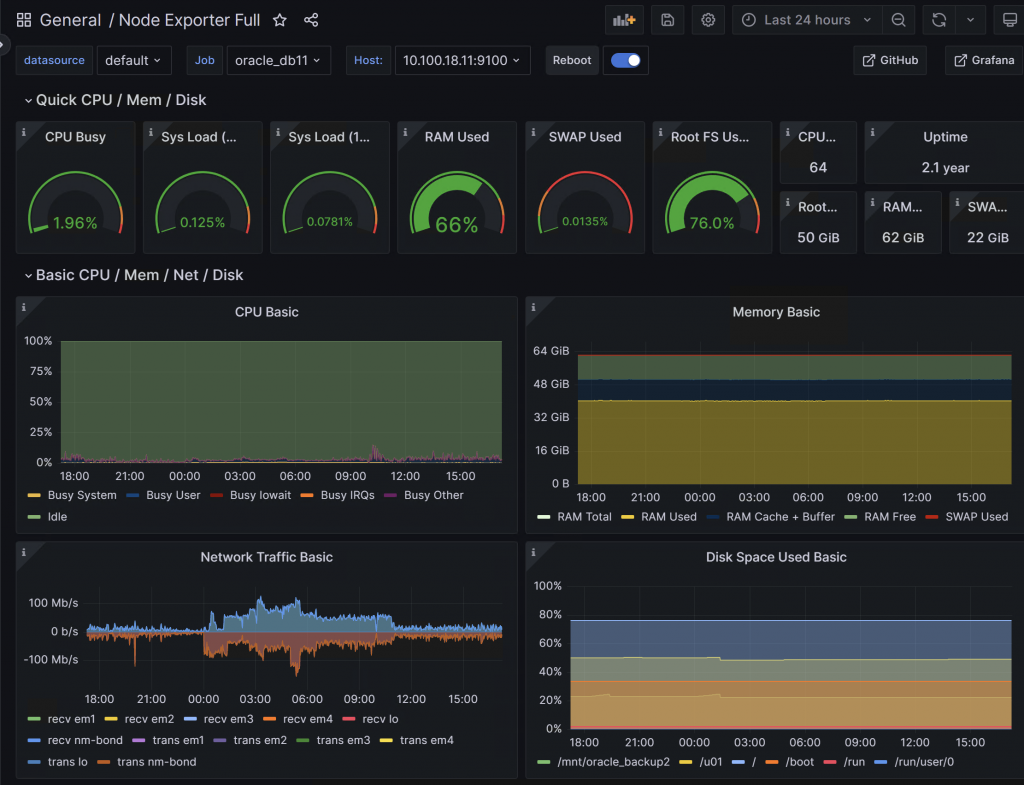
on target oracle host
wget https://github.com/prometheus/node_exporter/releases/download/v1.5.0/node_exporter-1.5.0.linux-amd64.tar.gz
724 28/03/23 08:15:16 ll /usr/local/bin/node_exporter
725 28/03/23 08:15:23 tar -xzvf node_exporter-1.5.0.linux-amd64.tar.gz
726 28/03/23 08:15:33 mv node_exporter-1.5.0.linux-amd64/node_exporter /usr/local/bin/
[root@prod-db1 ~]# cat /etc/systemd/system/node_exporter.service
[Unit]
Description=Node Exporter
[Service]
User=node_exporter
EnvironmentFile=/etc/sysconfig/node_exporter
ExecStart=/usr/local/bin/node_exporter $OPTIONS
[Install]
WantedBy=multi-user.target
727 28/03/23 08:15:44 systemctl status node_exporter
728 28/03/23 08:15:48 systemctl start node_exporter
729 28/03/23 08:15:50 systemctl status node_exporter
result
Usefull links